The Session Buddy console provides tools for diagnosing and troubleshooting problems.
If an issue occurs, the console may display error messages that can help Session Buddy support identify the problem.
How to access the console:
- Open a Session Buddy tab by clicking the Session Buddy icon in the browser toolbar.
- With Session Buddy as the active tab, open Chrome’s menu, go to “More tools“, and select “Developer tools“.
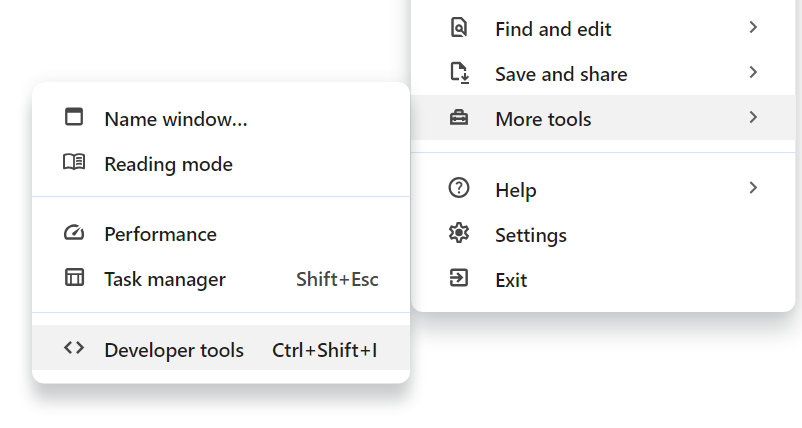
This will open the Developer Tools in a new window or pane. - In Developer Tools, select the Console tab to view recent Session Buddy activity or error messages.
- Some entries have an arrow on the left—click it to reveal additional details.
Alternative instructions
To access the console when Session Buddy won’t open, go to the following URL:
chrome://extensions/?id=edacconmaakjimmfgnblocblbcdcpbko
Ensure that “Developer mode” is toggled on in the upper-right corner of this page, then click the service worker link under “Inspect views“.
This will open the Developer Tools in a new window. Select the Console tab in this window to view recent Session Buddy activity or error messages.
Note that console commands and local storage editing are not available when opening the console this way.
Sharing console information
When sharing console information with Session Buddy support, provide either:
- A screenshot of the console with entries fully expanded, or
- A copy/pasted version of the console’s text. Right-click inside the console, then select either “Copy console” or “Save as…”
Console commands
The Session Buddy console includes some helpful commands. Type the command and hit ENTER to execute it.
saveData()
Downloads a file containing all collections and history. This can be useful if Session Buddy won’t open.
saveDiagnostics()
Downloads a file with diagnostic information that can help Session Buddy support get a better idea about the issue you’re experiencing.
repair()
Scans collections and history and repairs any data inconsistencies it finds. Reports on any issues detected and repaired.
debug()
Puts Session Buddy into debug mode.
debug(false)
Takes Session Buddy out of debug mode.